


Trade Of Aquatic Products
Significance of trade and latest trends
26 Aralık 2024 - 22:20 - Güncelleme: 26 Aralık 2024 - 22:27
A significant share of aquatic products enters international trade, contributing to employment, value addition, food supply and diversification, revenue generation, and overall economic growth and development. Moreover, trade plays a pivotal role in enhancing food and nutrition security by expanding access to a variety of nutritious aquatic foods.
Significance of trade
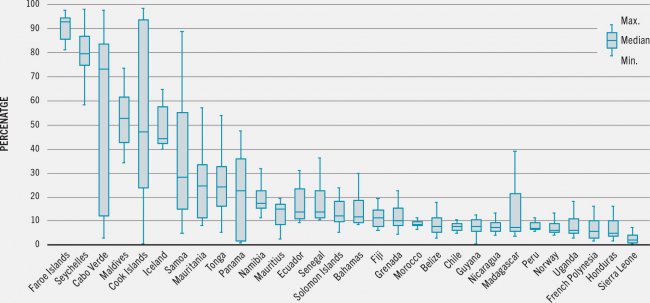
Aquatic animal products represent some of the most extensively traded food commodities on a global scale. The proportion of total aquatic animal production entering international trade has increased significantly. It rose from 25 percent in the mid-1970s to approximately 38 percent in 2022 – attesting to the sector’s increasing integration in the global economy. The trade of aquatic products is crucially important in numerous countries and regions. It is particularly important for communities in coastal, riverine, insular and inland areas, where exports of aquatic products constitute a substantial portion of overall merchandise trade, generating export earnings, jobs, income and socioeconomic growth. For example, exports of aquatic animal products contribute to over 30 percent of the total value of merchandise trade in countries and territories such as the Faroe Islands, Maldives and Seychelles. Globally, trade of aquatic animal products represented more than 9.1 percent of total agricultural trade (excluding forest products) and about 1 percent of total merchandise trade in value terms in 2022.
Long-term trends
Trade in aquatic products has expanded considerably in recent decades. Increased aquatic production provides the incentive to expand trade, but this expansion is enabled by improved storage, preservation, transportation and logistics together with competitive prices and liberalization policies. Indeed, reduced transportation costs, and improved technology, logistics and storage have facilitated the processing of aquatic products in locations far from their production site. Similarly, the trade of fresh aquatic products has resulted in competition from producers located thousands of miles away from the high-end fresh markets traditionally served only by local fishers and farmers. Such trends have resulted in the emergence of complex supply chains in which aquatic products often cross several national boundaries before final consumption. In parallel, control of the aquaculture production process has enabled producers to cater for consumer needs and innovate more effectively within supply chains. An increasing number of markets have gone from regional to global, and ever more producers are seizing new market opportunities. These transformations are most apparent in the expanded geographical participation in trade. In 2022, more than 200 countries and territories engaged in aquatic trade during the year compared with 150 in the mid-1970s.
World trade in aquatic animal products has grown significantly in value terms, with exports rising from USD 7.9 billion in 1976 to a record high of USD 192 billion in 2022,w at an average annual growth rate of 7.2 percent in nominal terms and 4.0 percent in real terms. Exports of algae contributed an additional USD 1.6 billion and exports of other aquatic products such as sponges, corals, shells and inedible by-products added an extra USD 0.9 billion in 2022. The total export value of all aquatic products reached a record high of USD 195 billion in 2022.
FIGURE 43WORLD MERCHANDISE AND AQUATIC ANIMAL EXPORT VALUE, FIXED-BASE INDICES (1976=100), 1976–2022
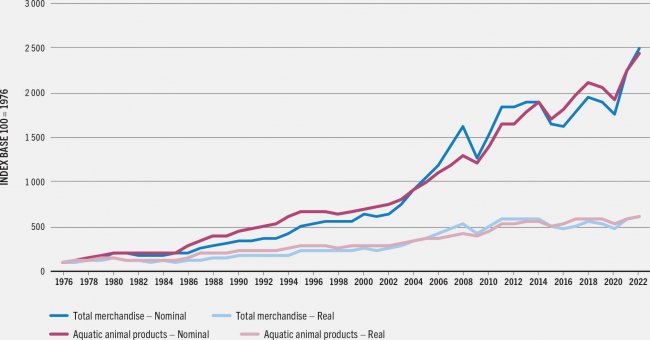
Similarly to the trade of other merchandise, trade of aquatic animal products is closely tied to the broader economic context. World merchandise exports have experienced strong growth since 1976, reaching USD 25 trillion in 2022, almost 25 times the value recorded in 1976. This is equivalent to an annual growth rate of 7.3 percent in nominal terms and 4.0 percent in real terms.
Despite its upward trend, aquatic animal trade has contracted on six occasions since 1976: in 1982, 1998, 2009, 2015, 2019 and 2020. Preliminary estimates for 2023 point to another decline of about 4 percent in the value of exports of aquatic animal products compared with 2022.
Short-term trends
Between 2020 and 2022, the international trade landscape was significantly influenced by the COVID-19 pandemic, and aquatic products were no exception. Compared with 2019, global aquatic animal exports and merchandise exports witnessed declines estimated at −6.7 percent and −6.9 percent, respectively. This severe downturn in 2020 was a consequence of widespread lockdowns, disruptions in supply chains, and reduced consumer demand. Nevertheless, there was a rapid rebound, as recovery commenced before the end of 2020.
FIGURE 44ANNUAL GROWTH RATE OF WORLD MERCHANDISE, AGRICULTURAL AND AQUATIC ANIMAL EXPORTS BY VALUE, 2010–2022
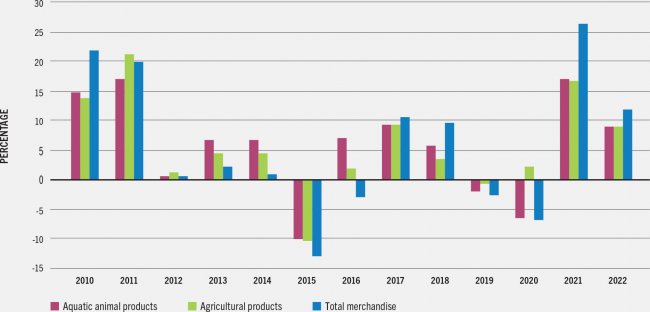
In 2021 and 2022, the value of global trade, including aquatic trade, experienced a rapid rebound, driven by a robust recovery in global demand and increasing commodity prices. Trade of aquatic animal products in 2022 increased by 19 percent relative to the pre-pandemic levels of 2019. The value of world merchandise exports recovered even more rapidly than that of aquatic animal exports, particularly in 2021, with a rise of 32 percent over the period 2019–2022.
Slower growth in traded volumes
From 2020, the dynamics of aquatic trade have been influenced not just by changes in worldwide demand since the COVID-19 pandemic but also by variations in prices. A significant proportion of the increase in the global trade of aquatic products has been in value, with trade in volumes experiencing a more moderate expansion. Between 2019 and 2022, world exports of aquatic animal products increased by 5.7 percent in volume, compared with 19 percent in value over the same period reflecting a steady increase in unit value. In 2022, the unit value of exported aquatic animal products averaged USD 2.7 per kg (live weight equivalent), up from USD 2.4 in 2019 and an increase of 12 percent.
According to the FAO Fish Price Index, average international fish prices in 2022 were 19 percent higher than 2021 prices, which in turn were 6.4 percent higher than 2020 prices. They then stabilized over 2023, marginally down compared with their level in 2022. Such inflation was not specific to aquatic products but extended to food prices in general. The FAO Food Price Index (which excludes fish prices) increased by 28 percent in 2021 and by another 15 percent in 2022. However, a notable reversal occurred in 2023, with food prices (excluding fish) experiencing a decline of 14 percent.
Significance of trade
Aquatic animal products represent some of the most extensively traded food commodities on a global scale. The proportion of total aquatic animal production entering international trade has increased significantly. It rose from 25 percent in the mid-1970s to approximately 38 percent in 2022 – attesting to the sector’s increasing integration in the global economy. The trade of aquatic products is crucially important in numerous countries and regions. It is particularly important for communities in coastal, riverine, insular and inland areas, where exports of aquatic products constitute a substantial portion of overall merchandise trade, generating export earnings, jobs, income and socioeconomic growth. For example, exports of aquatic animal products contribute to over 30 percent of the total value of merchandise trade in countries and territories such as the Faroe Islands, Maldives and Seychelles. Globally, trade of aquatic animal products represented more than 9.1 percent of total agricultural trade (excluding forest products) and about 1 percent of total merchandise trade in value terms in 2022.
Long-term trends
Trade in aquatic products has expanded considerably in recent decades. Increased aquatic production provides the incentive to expand trade, but this expansion is enabled by improved storage, preservation, transportation and logistics together with competitive prices and liberalization policies. Indeed, reduced transportation costs, and improved technology, logistics and storage have facilitated the processing of aquatic products in locations far from their production site. Similarly, the trade of fresh aquatic products has resulted in competition from producers located thousands of miles away from the high-end fresh markets traditionally served only by local fishers and farmers. Such trends have resulted in the emergence of complex supply chains in which aquatic products often cross several national boundaries before final consumption. In parallel, control of the aquaculture production process has enabled producers to cater for consumer needs and innovate more effectively within supply chains. An increasing number of markets have gone from regional to global, and ever more producers are seizing new market opportunities. These transformations are most apparent in the expanded geographical participation in trade. In 2022, more than 200 countries and territories engaged in aquatic trade during the year compared with 150 in the mid-1970s.
World trade in aquatic animal products has grown significantly in value terms, with exports rising from USD 7.9 billion in 1976 to a record high of USD 192 billion in 2022,w at an average annual growth rate of 7.2 percent in nominal terms and 4.0 percent in real terms. Exports of algae contributed an additional USD 1.6 billion and exports of other aquatic products such as sponges, corals, shells and inedible by-products added an extra USD 0.9 billion in 2022. The total export value of all aquatic products reached a record high of USD 195 billion in 2022.
FIGURE 43WORLD MERCHANDISE AND AQUATIC ANIMAL EXPORT VALUE, FIXED-BASE INDICES (1976=100), 1976–2022
Similarly to the trade of other merchandise, trade of aquatic animal products is closely tied to the broader economic context. World merchandise exports have experienced strong growth since 1976, reaching USD 25 trillion in 2022, almost 25 times the value recorded in 1976. This is equivalent to an annual growth rate of 7.3 percent in nominal terms and 4.0 percent in real terms.
Despite its upward trend, aquatic animal trade has contracted on six occasions since 1976: in 1982, 1998, 2009, 2015, 2019 and 2020. Preliminary estimates for 2023 point to another decline of about 4 percent in the value of exports of aquatic animal products compared with 2022.
Short-term trends
Between 2020 and 2022, the international trade landscape was significantly influenced by the COVID-19 pandemic, and aquatic products were no exception. Compared with 2019, global aquatic animal exports and merchandise exports witnessed declines estimated at −6.7 percent and −6.9 percent, respectively. This severe downturn in 2020 was a consequence of widespread lockdowns, disruptions in supply chains, and reduced consumer demand. Nevertheless, there was a rapid rebound, as recovery commenced before the end of 2020.
FIGURE 44ANNUAL GROWTH RATE OF WORLD MERCHANDISE, AGRICULTURAL AND AQUATIC ANIMAL EXPORTS BY VALUE, 2010–2022
In 2021 and 2022, the value of global trade, including aquatic trade, experienced a rapid rebound, driven by a robust recovery in global demand and increasing commodity prices. Trade of aquatic animal products in 2022 increased by 19 percent relative to the pre-pandemic levels of 2019. The value of world merchandise exports recovered even more rapidly than that of aquatic animal exports, particularly in 2021, with a rise of 32 percent over the period 2019–2022.
Slower growth in traded volumes
From 2020, the dynamics of aquatic trade have been influenced not just by changes in worldwide demand since the COVID-19 pandemic but also by variations in prices. A significant proportion of the increase in the global trade of aquatic products has been in value, with trade in volumes experiencing a more moderate expansion. Between 2019 and 2022, world exports of aquatic animal products increased by 5.7 percent in volume, compared with 19 percent in value over the same period reflecting a steady increase in unit value. In 2022, the unit value of exported aquatic animal products averaged USD 2.7 per kg (live weight equivalent), up from USD 2.4 in 2019 and an increase of 12 percent.
According to the FAO Fish Price Index, average international fish prices in 2022 were 19 percent higher than 2021 prices, which in turn were 6.4 percent higher than 2020 prices. They then stabilized over 2023, marginally down compared with their level in 2022. Such inflation was not specific to aquatic products but extended to food prices in general. The FAO Food Price Index (which excludes fish prices) increased by 28 percent in 2021 and by another 15 percent in 2022. However, a notable reversal occurred in 2023, with food prices (excluding fish) experiencing a decline of 14 percent.


YORUMLAR